

Note: This view also provides access to practices to improve learning conditions.
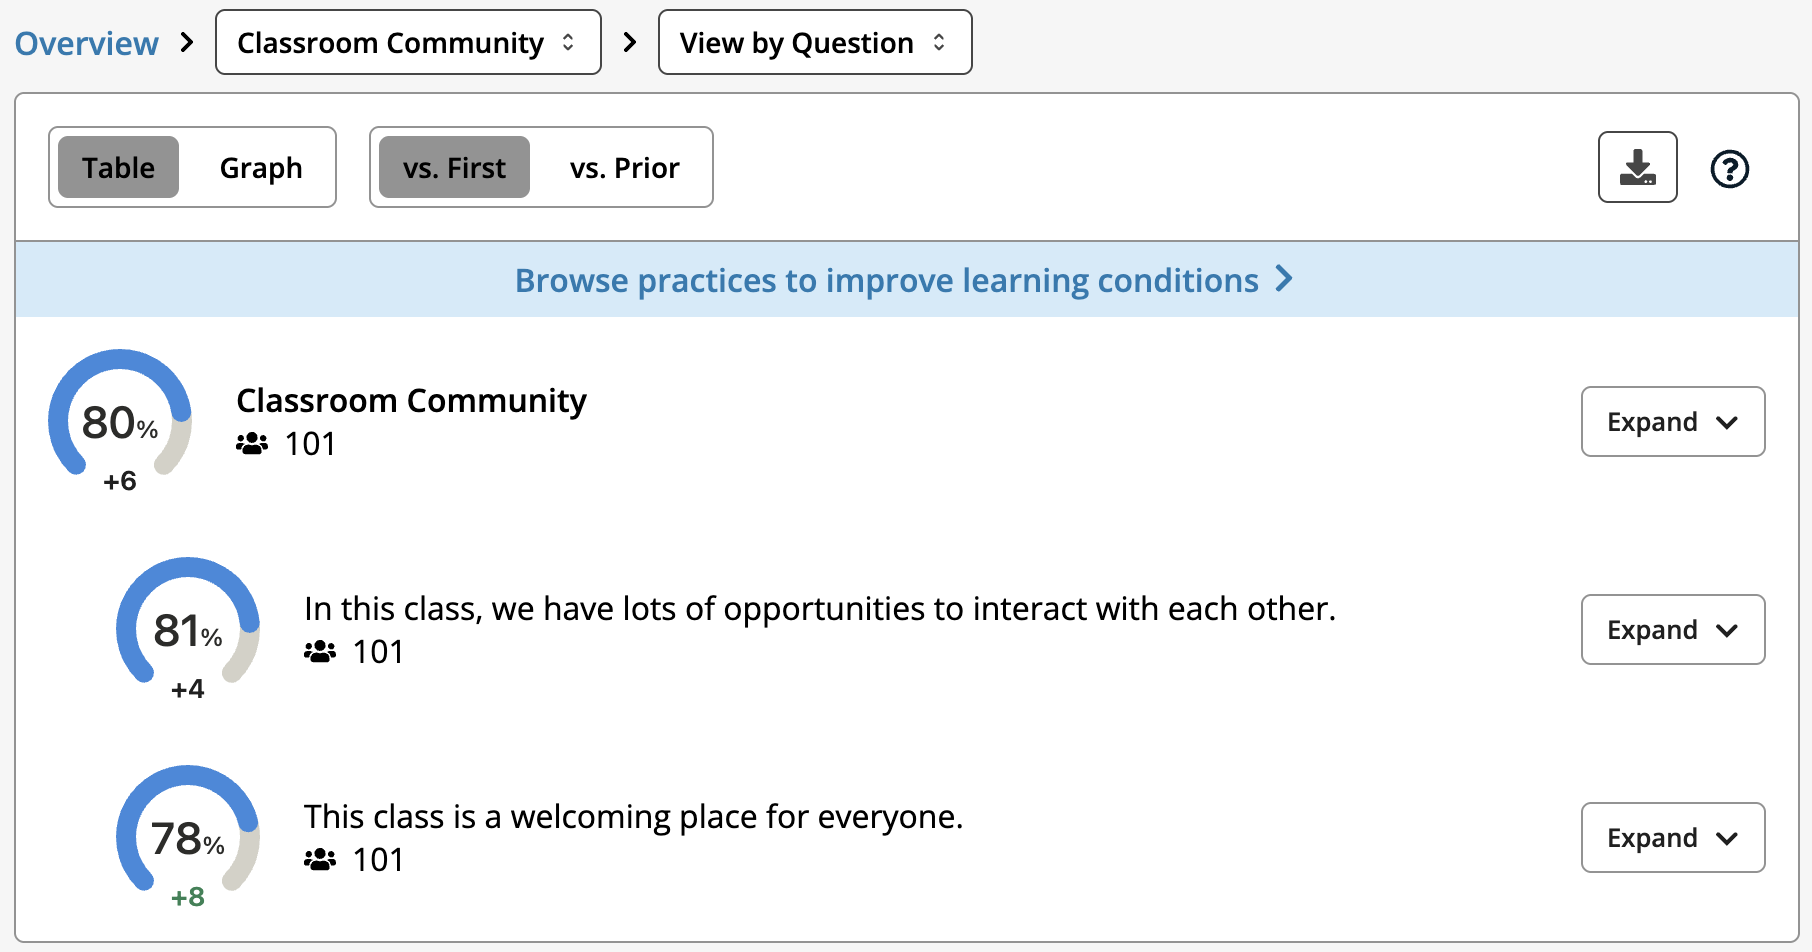
Detailed results can be viewed for any learning condition so that you can dig much deeper into your data. Several detailed views are provided:
By using the dropdown at the top, results can be viewed by question or disaggregated by gender, race/ethnicity, and focal group (if selected). In Ascend reports, results can also be viewed by basic needs security and first-generation college attendance. And, Network reports also show results by Community. The number of responses is always recorded for each data point.
When the survey is completed more than once, the vs. First / vs. Prior toggle shows change from the first survey to the most recent or change from the prior survey to the most recent, e.g., survey 3 compared to survey 1 or survey 3 compared to survey 2.
Clicking Expand shows the response distribution by survey.
Toggling from the Table view to the Graph view shows change over time with a line graph that contains a data point for each survey.
Below are a few tips for using the detailed results.
Examine results by question/item. View results for each individual item included in any learning condition and how they may have changed over time. This information can signal which items have the most opportunity for growth or give you a sense of what items are driving the overall changes you see. For example, if you notice improvement in all items except for one, you might ask why students’ answers to that particular question may not be changing.
Check for student experience gaps between groups. If you notice that equity gaps are strong for a particular group, explore why students from different backgrounds are having different experiences.
Observe change since the previous survey. If you’ve made significant changes to your practice since the previous survey, the difference between the last two points can help you see how those changes impacted student experience.
Look for trends over time. Changes from survey to survey can unearth insights about the impact of specific practices and other factors that affect students’ experiences. For example, if an initial improvement later returns to baseline, perhaps the strategies that caused the initial improvement are no longer being implemented. Or perhaps the course has become more challenging and students now need more support than they did before. Many instructors find it helpful to explicitly debrief results with students to learn what’s going well and how further improvements could be made.
Examine results by Community (in Network Reports). Seeing Communities side-by-side allows you to identify strategies that may be particularly effective, especially if you see precipitous improvements.
Related articles
How are responses to negatively worded questions displayed in reports?
What do we do with missing data (when participants skip a survey)?